 P4 WHITE
SOURCE
P4 WHITE
SOURCE
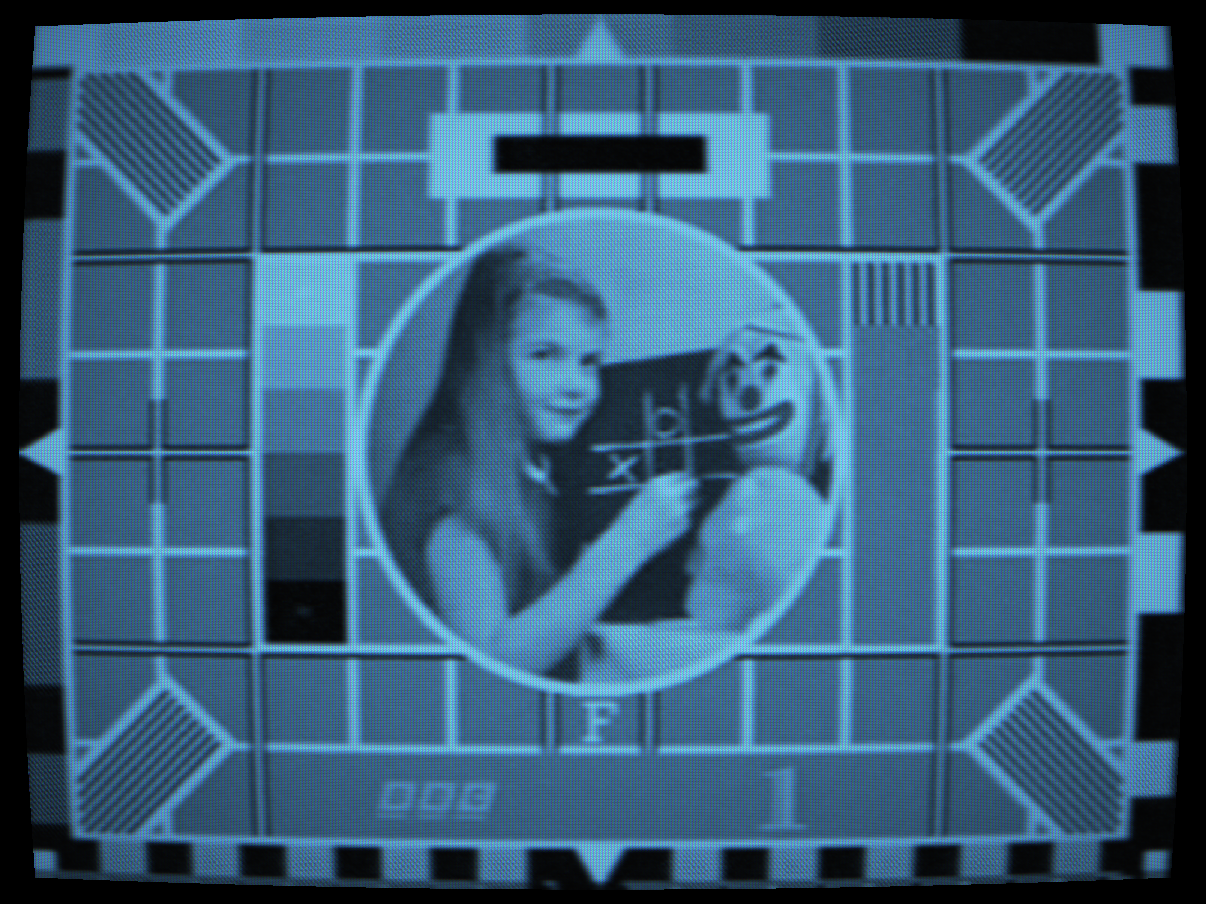
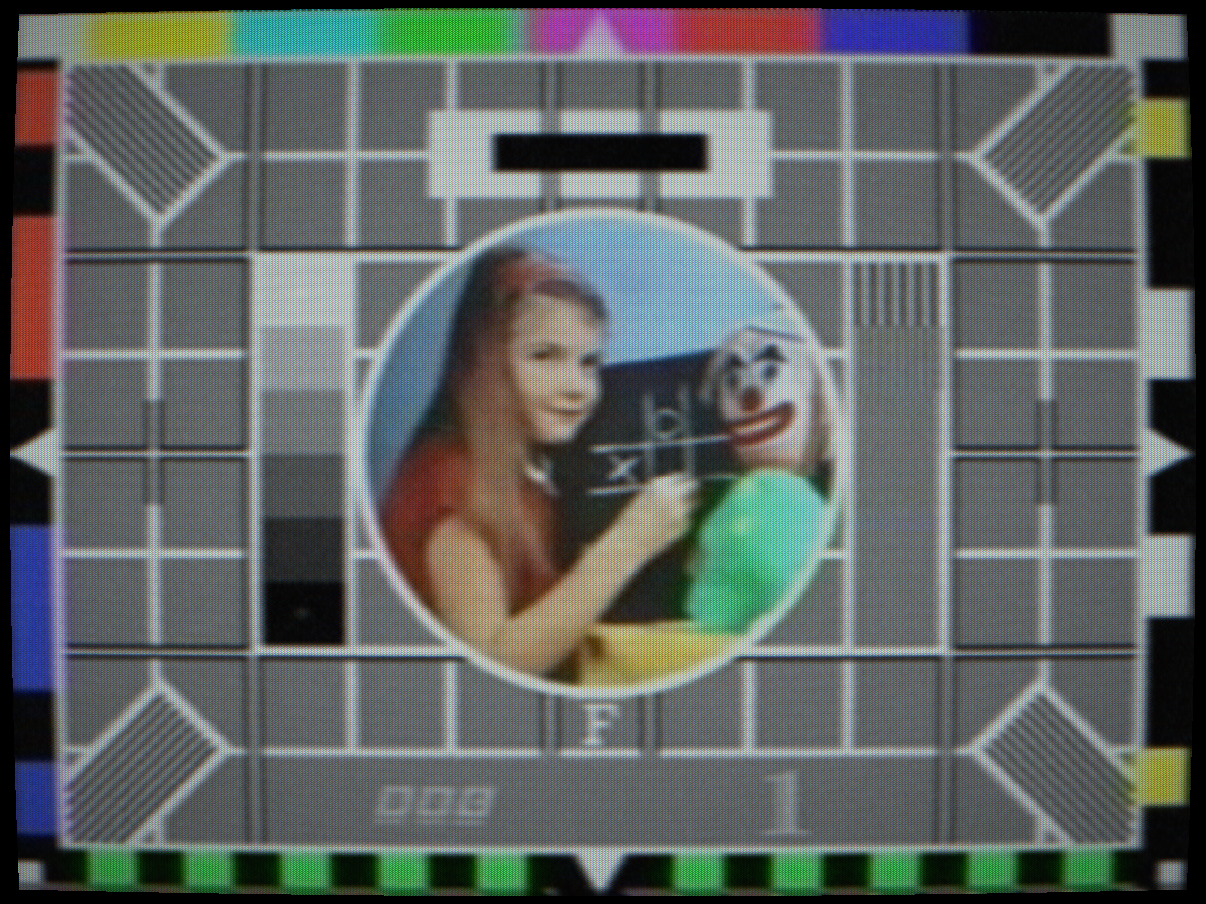
P4 phosphor: B&W television white, shadow mask
 P3 AMBER
SOURCE
P3 AMBER
SOURCE
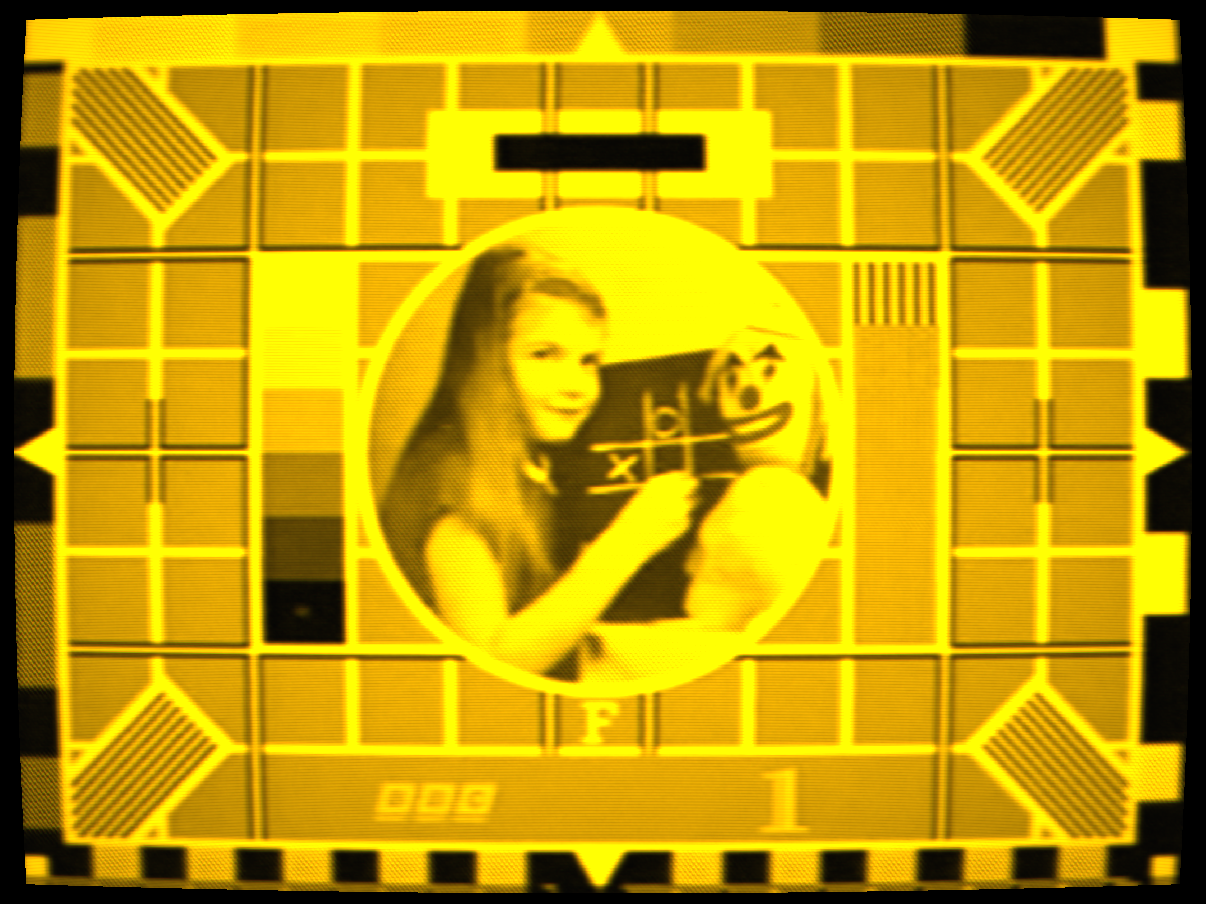
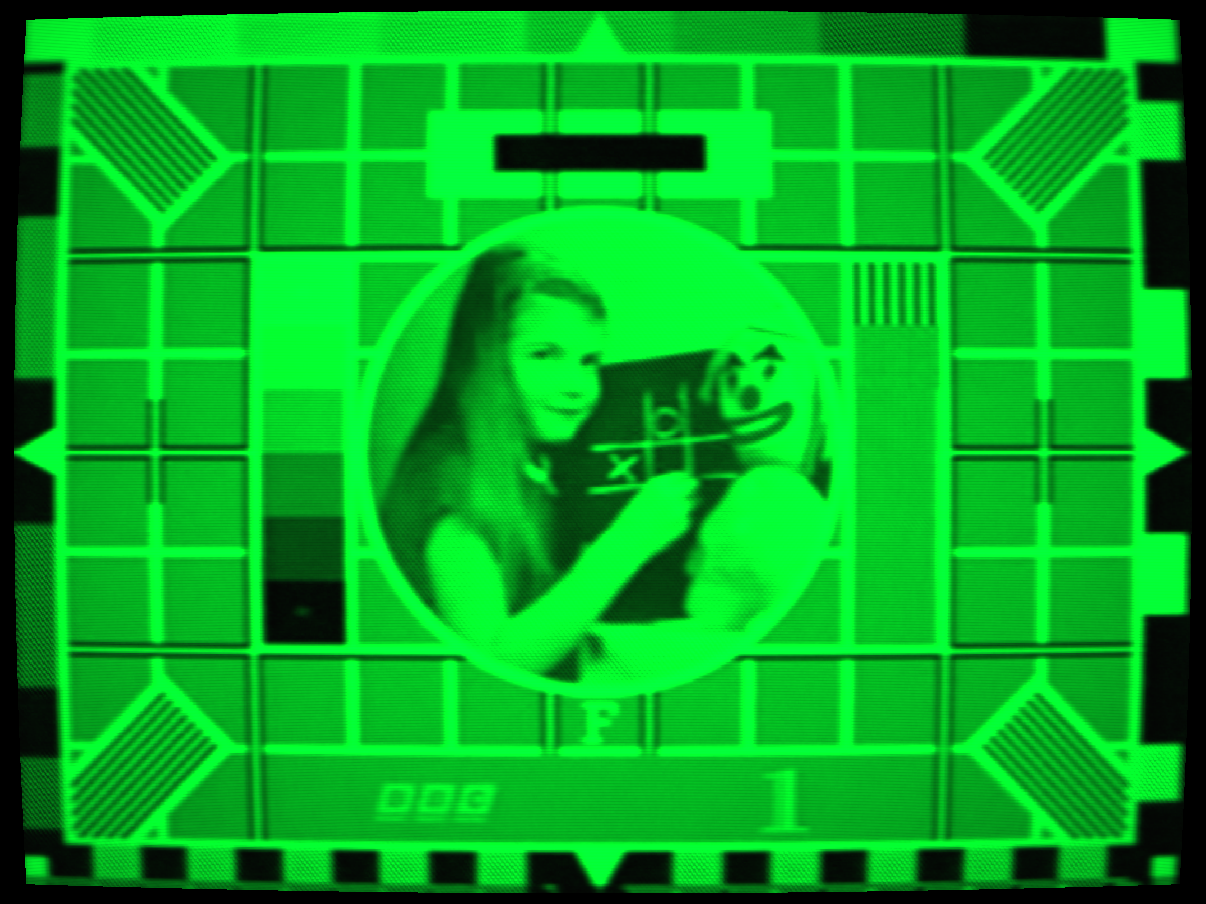
P3 phosphor: ZnS:Mn amber, early terminal and radar display
 SCANLINES
NONE
SCANLINES
NONE
Scanlines: horizontal raster structure from electron beam width
 BLOOM
NONE
BLOOM
NONE
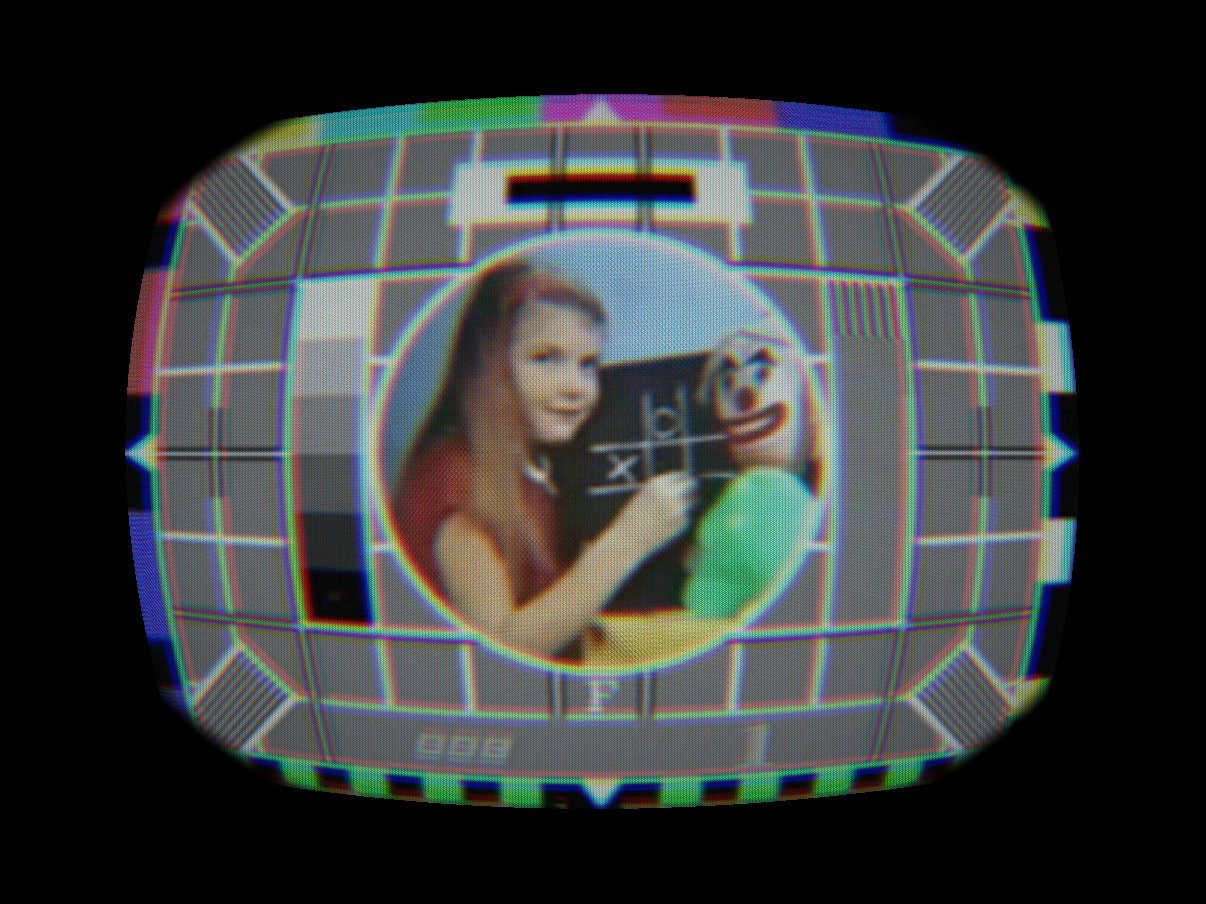
Bloom & halation: light spreading through phosphor and glass faceplate
 P22 CRT
SOURCE
P22 CRT
SOURCE
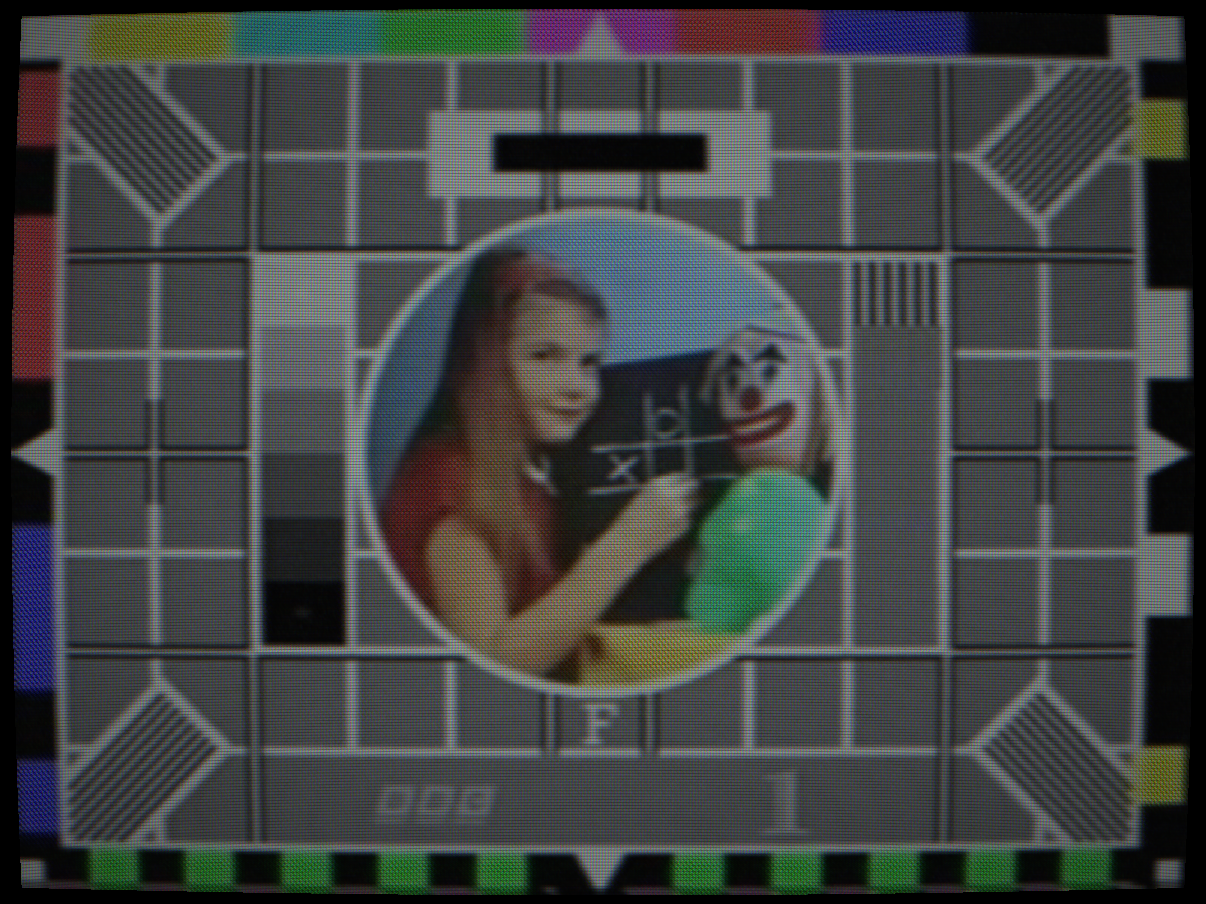
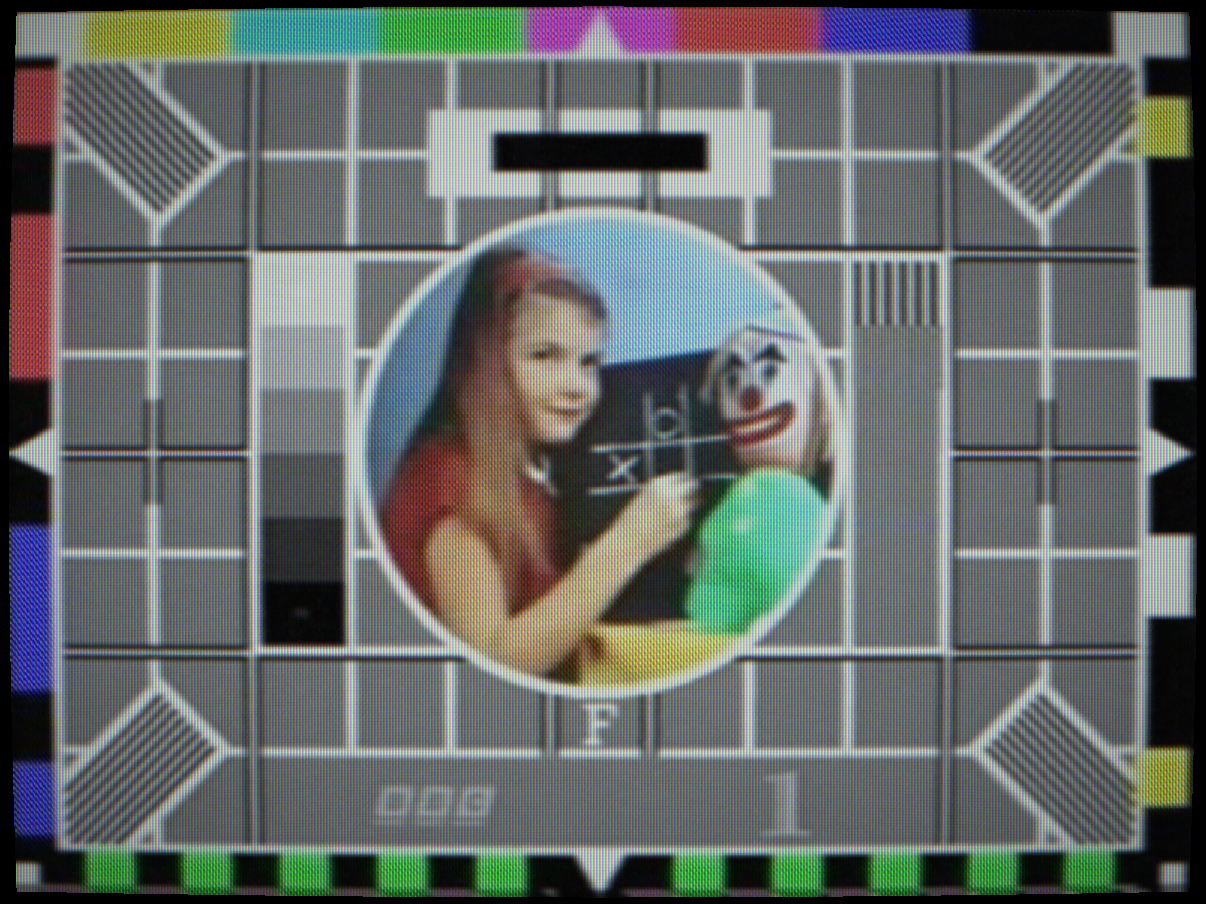
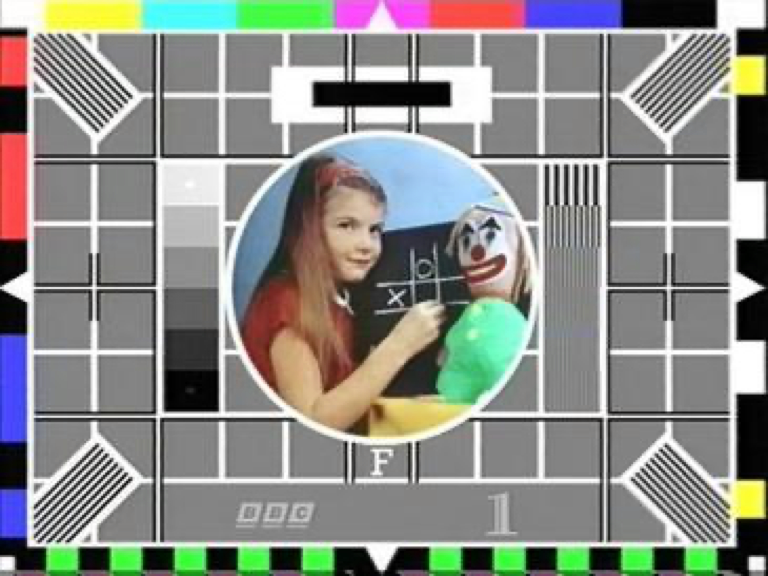
P22 colour phosphor: shadow mask, scanlines, bloom
 P31 MONO
COLOUR
P31 MONO
COLOUR
P31 mono: colour input, single-phosphor output
 APERTURE GRILLE
SHADOW MASK
APERTURE GRILLE
SHADOW MASK
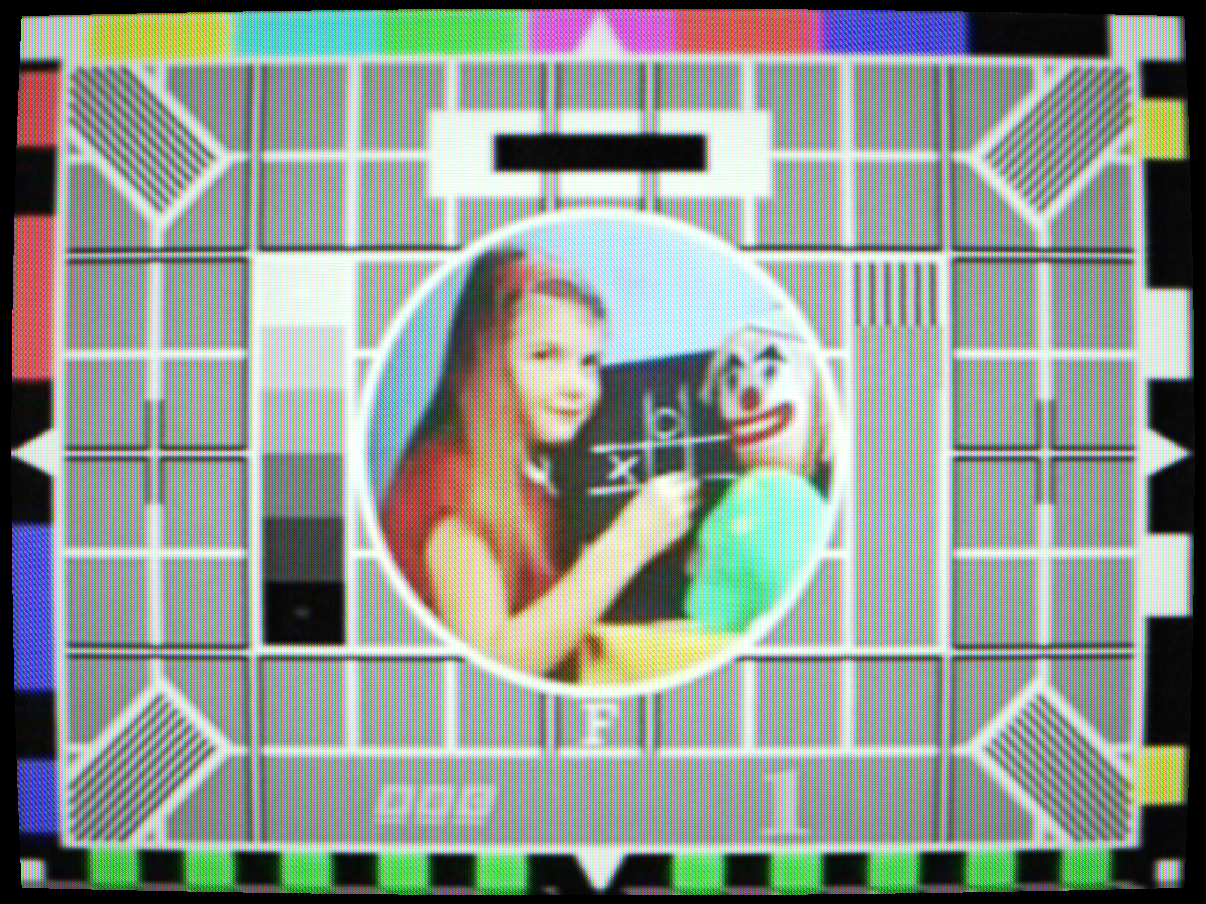
Aperture grille: Sony Trinitron vertical slot structure
 CURVED
FLAT
CURVED
FLAT
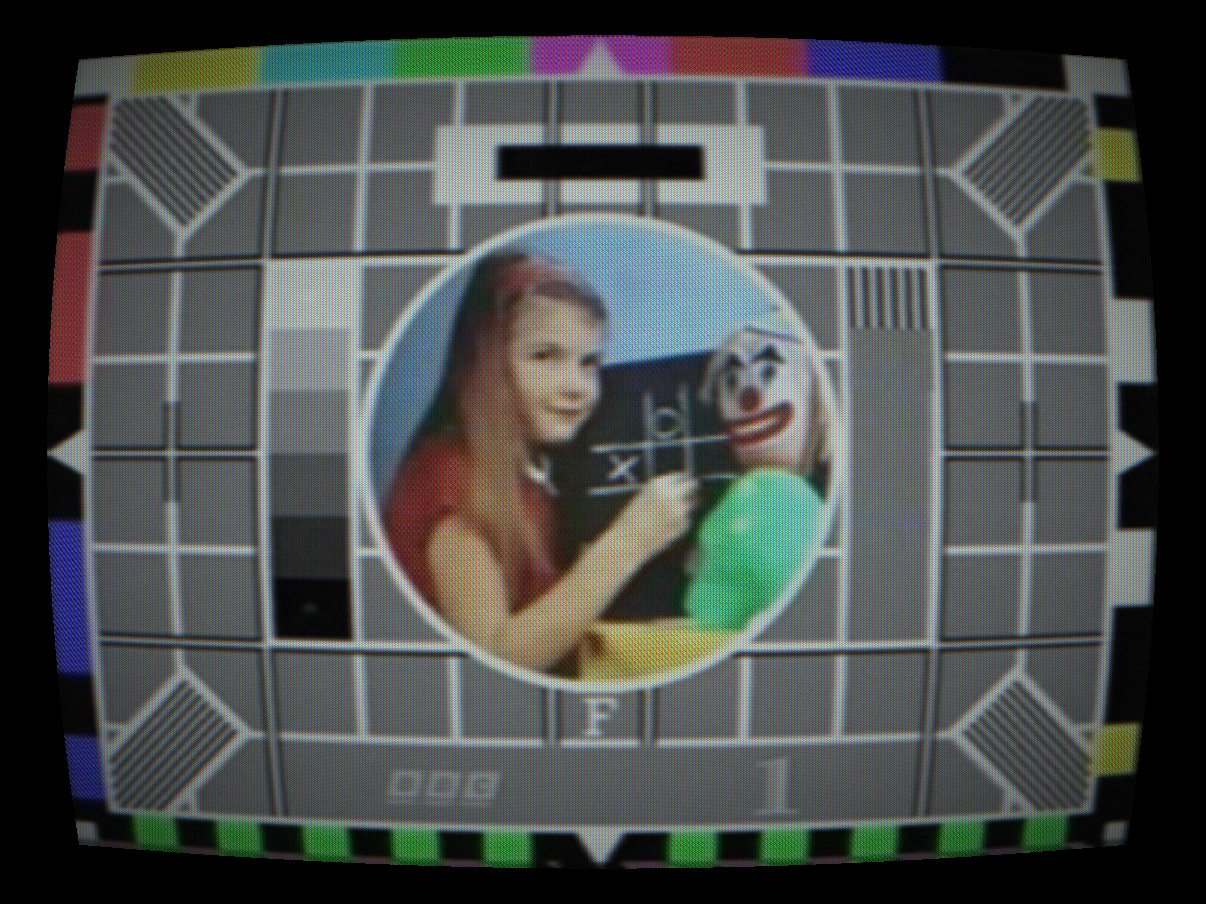
Face-plate curvature: barrel distortion on spherical glass

 MISCONVERGED
CONVERGED
MISCONVERGED
CONVERGED
Convergence error: RGB gun misalignment, colour fringing

 SVM ON
SVM OFF
SVM ON
SVM OFF
Shadow velocity modulation: beam speed sharpening
 КВН LENS
NORMAL
КВН LENS
NORMAL
КВН-49 water magnifier: Soviet glycerol lens tank, fishbowl barrel distortion

 YOKE RING
CLEAN
YOKE RING
CLEAN
Yoke ringing: deflection-coil resonance after sharp edges
CRT shutdown: HV capacitor discharge collapses the raster to a white spot
Degauss: PTC thermistor field decay washes a rainbow across the screen
Controls
CRT Enable, master switch for all CRT simulation. When off, the output is the raw decoded composite signal without any phosphor, scanline, mask, geometric or halation processing. Useful for evaluating the upstream signal quality without the CRT aesthetics.
Beam Enable, controls whether the electron gun raster-scan timing simulation is active. The distinction matters for the phosphor decay behaviour.
With Beam on, the phosphor is written line-by-line from top to bottom at the scan rate of the selected standard (15.625 kHz for PAL, 15.734 kHz for NTSC). The phosphor at the top of the frame has been decaying for an entire field period by the time the bottom is scanned. This creates the correct asymmetric decay: recent lines (bottom) are brighter than old lines (top).
With Beam off, the entire frame is treated as a simultaneous exposure and the phosphor decay is set to zero, the frame is instantly mapped through the phosphor’s colour temperature and emission spectrum, then displayed without temporal decay. This mode is useful for correct colour temperature mapping on non-P22 phosphors without introducing motion smear.
How to test: Set Phosphor Type to P31 (green) and view a white source. With Beam off: image is immediate monochrome green. With Beam on: image has the temporal decay characteristic, recent lines glow brighter, older lines have already decayed slightly. Move a bright object and watch the persistence trail that follows.
Electron beam scan line visibility. In a real CRT, each horizontal scan line illuminates a stripe of phosphor. Between successive scan lines there is a dark gap where the beam was not present. The apparent gap width depends on the spot size (controlled by beam focus and gun design) and the number of scan lines (525 or 625). On a large screen at close viewing distance, these gaps are clearly visible.
The simulation applies a multiplicative modulation to the vertical position within each pixel row: the centre of each scan line is at full brightness; the transition into the inter-line gap darkens proportionally to this control.
Interactions: Scanline Strength combines with Bloom, high bloom causes the phosphor to glow laterally and partially fill the inter-line gap, making the scan lines less distinct even at high Scanline Strength. This is physically correct: heavily blooming phosphors (P31 in particular) had less visible scan lines than P4 or P22 under the same drive.
How to test: Set to 0.8, view a white field, and zoom in or use the display at a large physical size. Alternating bright and dark horizontal stripes become clearly visible, spaced at one-scan-line intervals. At 0, the output is perfectly uniform between lines.
IIR phosphor persistence coefficient. Real phosphors continue to emit light after the electron beam has passed, with a decay curve determined by the phosphor chemistry. The simulation uses a first-order IIR filter: phosphor[t] = decay * phosphor[t-1] + (1-decay) * beam[t]. This runs per-pixel in a ping-pong texture pair, every frame.
The specific decay values are calibrated against measured luminance-decay curves for each phosphor type. P31 (zinc orthosilicate) has a measured decay of around 35 ms to 10% at 25°C, corresponding to a decay coefficient of approximately 0.93 at 60 fps. P22 green phosphor decays much faster (~1–3 ms).
At extreme values (0.97), the effective persistence is many seconds, approaching the measured P7 two-layer radar phosphor decay. At 0.0, the phosphor is instantaneous (no persistence), producing the sharpest possible motion but missing the characteristic glow trail of CRT phosphors.
Interactions: The ping-pong texture pair uses a 0.9995 coefficient IIR for the burn-in texture (very long time constant, ~115 seconds half-life) independently of this control. Phosphor Decay only controls the per-frame display persistence, not the burn-in accumulation.
How to test: Set to 0.85. Move the source camera quickly or change the source. Bright trails persist for 3–5 frames before decaying. Set to 0.95 (trails persist for 20+ frames. Set to 0) no trail at all.
Selects the phosphor chemistry deposited on the inner face of the CRT glass. Each phosphor has a specific emission spectrum (colour), persistence (decay curve) and brightness efficiency. All values are derived from primary RCA TPM-1508A and Philips/Mullard phosphor datasheets.
P22, Standard colour television triad (RGB three-dot or three-stripe). Red: europium-activated yttrium vanadate (~620 nm, 3–6 ms decay). Green: zinc silicate / terbium-activated (~540 nm, 1–3 ms). Blue: europium-activated BAM (~450 nm, 0.5–2 ms). The standard for colour CRTs from 1954 through the 2000s.
P31, Zinc orthosilicate (Zn2SiO4:Mn). Vivid green emission (~525 nm). Long persistence: 35 ms to 10%. Used in oscilloscopes, radar displays, and early computer monitors. The classic “green screen” phosphor.
P45, Fast white phosphor. Yttrium oxide:Eu/Tb or similar fast-decay white formulation. Used in broadcast monitor CRTs where motion smear must be minimised. Short decay: ~1 ms to 10%.
P4, “Television white”. Mixture of blue zinc sulphide and yellow zinc-cadmium sulphide for near-white emission. Used in all B&W television sets from the 1940s through the 1980s. Slightly warm (yellowish) white compared to P45. Moderately fast decay (~3 ms).
P3, Amber industrial phosphor. Zinc cadmium sulphide. Long persistence. Used in industrial CRT displays and some early computer terminals where readability was prioritised over speed.
P7, Radar two-layer: a fast blue (ZnS) flash layer overlaid on a slow yellow-green (ZnCdS) persistence layer. The fast layer gives a white flash at beam passage; the slow layer leaves a long yellow-green afterimage. Decay: 40 ms to 10% for the slow layer, <1 ms for the fast layer.
P11, Deep blue photographic phosphor. Zinc sulphide:Ag (silver-activated). Emission peak ~460 nm, very deep blue. Used in photographic CRT printers and some scientific instruments. Fast decay but very narrow blue emission band.
P24, Professional broadcast green monitor phosphor. Higher brightness, more stable green emission than P31. Used in colour-reference green channels of broadcast waveform monitors.
Interactions: Phosphor Type combined with Black & White Mode produces physically accurate monochrome monitor simulations. Phosphor Type also affects the colourimetry of colour images in P22 mode: the exact green, red and blue primaries define the colour gamut, and the simulation uses the measured CIE xy coordinates for each phosphor.
How to test: Enable B&W Mode. Cycle through P4, P31, P3 and P24. Each gives a distinctly different output colour: warm white (P4), vivid green (P31), amber (P3) and professional-monitor green (P24). The Phosphor Decay slider interacts differently with each because their measured decay curves differ.
Electron gun shadow mask or aperture grille. The mask is a precision metal screen between the electron gun and the phosphor, with apertures that allow each gun’s beam to strike only its intended phosphor dots or stripes.
Shadow Mask, Traditional staggered-dot design. A flat (or slightly curved) metal sheet perforated with rows of small circular holes, offset from row to row. Each hole aligns with a phosphor dot trio (R-G-B). The mask absorbs a significant fraction of the beam current (~80%), reducing brightness but giving excellent colour purity. Used by virtually all non-Sony CRT manufacturers. The characteristic sub-pixel “dot trio” pattern is visible at high zoom.
Aperture Grille, Sony Trinitron (1968) and Mitsubishi Diamondtron design. Vertical metal wires stretched across the tube’s width replace the perforated sheet. Each vertical strip allows a single beam to strike a vertical RGB stripe. Advantages: more beam current reaches the phosphor (higher brightness), vertical stripes give sharper horizontal resolution, simpler manufacturing for cylindrical tubes. Disadvantages: requires damper wires visible as faint horizontal lines at 1/3 and 2/3 height on large tubes; cylindrical curvature only (cannot make flat aperture grille tubes). The characteristic vertical-stripe sub-pixel pattern is visible at high zoom.
Interactions: Shadow Mask and Aperture Grille both interact with Scanline Strength, the mask pattern compounds with the horizontal scanline pattern to produce the characteristic “RGB dot grid” or “RGB stripe+scanline” texture. Zoom level of the host display determines how visible the mask pattern is.
How to test: Select Shadow Mask, zoom in to maximum zoom on the display. Individual dot trios are visible. Switch to Aperture Grille (the dot pattern changes to vertical stripes. Switch to None) no sub-pixel structure is visible at any zoom.
Two physically distinct light-spreading mechanisms that together create the characteristic CRT glow around bright areas.
Bloom, Electron-optical scatter within the electron gun and beam. At high beam current (bright areas), the electrostatic lens in the gun cannot focus the beam as tightly; the spot broadens. Additionally, secondary electrons scattered from the shadow mask deposit energy on the phosphor in a wider area than the direct beam. Bloom therefore increases with beam current (brightness), and its spatial extent is relatively tight (a few lines/columns).
Halation, Light scatter within the glass envelope itself. Photons emitted by the phosphor scatter inside the glass faceplate (total internal reflection effects, diffusion in the glass, reflection off the funnel). This scatter is larger in spatial extent than bloom, the halation halo extends much further from the bright area but is much dimmer. In real CRTs this was partially controlled by the aquadag coating and the Aluminising layer behind the phosphor.
The two controls should generally be set together: Bloom for the tight inner glow, Halation for the diffuse outer corona. Together they reproduce the characteristic “burning through” look of bright white text on a CRT at high contrast.
How to test: View white text on a black background. Set Bloom to 0.4, Halation to 0.0 (a tight glow appears immediately around each letter. Now add Halation to 0.3) a wide soft corona appears around the entire text, extending well beyond the tight bloom. The combination looks like an over-driven broadcast monitor.
Curvature, Screen face-plate geometry. Almost all CRTs used spherical or cylindrical glass, which caused the displayed image to conform to the curved surface. Geometry correction circuits in the deflection system partially compensated, but residual curvature (barrel or pincushion distortion) was visible on all but the most expensive professional displays. The simulation applies a radial barrel warp proportional to this control, matching the typical spherical CRT face-plate curvature.
Shadow-mask tubes had both vertical and horizontal curvature (spherical face). Trinitron tubes were cylindrical (curved only horizontally, flat vertically) which is reproduced in the Aperture Grille mask mode.
Vignette, Beam current fall-off at screen edges. The electron beam must be deflected through larger angles to reach the corners of the screen. At large deflection angles: (1) the shadow mask apertures present a smaller projected area to the beam, reducing beam current reaching the phosphor; (2) the electron beam spot enlarges and defocuses at large angles due to the gun’s finite aberration; (3) the phosphor efficiency is slightly lower at the extreme edges. All three effects darken the corners, modelled together as a radial vignette.
Interactions: Curvature and Vignette combine spatially: the corners of the image receive both the geometric push of the curvature and the brightness reduction of the vignette. Together they give the characteristic “rounded and dark at the corners” look of spherical CRTs from the 1960s–80s. Flat-screen CRTs from the late 1990s had much lower curvature and vignette.
RGB electron gun misalignment. In a colour CRT, three separate electron guns (R, G, B) must converge their beams precisely on each shadow mask aperture across the entire screen. This convergence is set at the factory using static and dynamic convergence circuits, but mechanical drift (from heat, vibration, or ageing magnets) causes the convergence to deteriorate over time.
The drift is geometrically non-uniform: worst at the screen corners (largest deflection angle) and better at the centre. A drifted gun causes colour fringing at edges, white text appears with a red fringe on one side and blue on the other, or vice versa, depending on which gun has drifted and in which direction.
The simulation applies independent per-gun spatial offsets that increase with distance from the centre, matching the geometry of a real CRT with thermally-induced purity drift. The pattern is not uniform, the horizontal and vertical drift magnitudes are independently varied, mimicking the real asymmetry of in-line gun arrays (the dominant consumer gun geometry from the 1970s).
How to test: Set Convergence Drift to 0.6 and view white vertical lines at the screen edge. Red and blue fringing appear on opposite sides of each line, with the fringing much more severe at the screen corners than at the centre. The fringing direction and magnitude change non-uniformly as you scan the image from centre to edge.
The КВН-49 (КВН-49) was the USSR’s first mass-produced television receiver, introduced in 1949. Its name is an acronym of its three designers: Королёв, Варшавский, and Николаевский. Its VQP-105 CRT produced an image just 105×140 mm, roughly postcard-sized. To make this watchable from across a room, Soviet buyers purchased a separate accessory: a rectangular tank of distilled water or glycerol, sealed behind a curved glass face and clamped to the front bezel. The water-filled positive meniscus lens magnified the tiny raster to a usable size.
Barrel distortion, a water-filled convex lens produces strong barrel distortion. The centre of the image is magnified significantly more than the edges, pulling the corners inward and giving the characteristic fishbowl appearance. The simulation maps Strength 0–1 to a barrel coefficient far higher than the standard CRT curvature control.
Chromatic aberration, water (Abbe number Vd ≈ 55.9) disperses blue light more than red. Through a thick curved water lens, the RGB channels focus at slightly different distances. Toward the periphery, sharp edges grow coloured fringes and fine detail blooms into a rainbow smear.
KVN Ripple, the lens tank was a sealed enclosure, but thermal convection and the mechanical vibration from the TV’s transformer and speaker created slow waves across the liquid meniscus. Ripple simulates this fluid oscillation; the wave pattern animates slowly over time.
How to test: Enable КВН Lens, set Strength to 0.6, Ripple to 0.2. View a crosshatch test pattern. The grid bows outward with barrel distortion, colour fringes appear at the edges, and a slow wave undulation drifts across the image as if viewed through a bowl of water. Tilt your iPhone to shift the view window through the lens.