In 1949, the Soviet Union released the КВН-49, the USSR's first mass-produced television receiver. The name was an acronym of its three designers: Королёв, Варшавский, and Николаевский. It was tiny, it was expensive (900 roubles, about six months' salary for an average worker), and it had a problem that Soviet engineers solved in a way that became one of the most recognisable objects in post-war Soviet domestic life: the screen was only 105 × 140 mm, about the size of a cigarette packet.
The solution was a separate accessory that attached to the front of the set: a rectangular tank filled with distilled water or glycerol, sealed behind a curved glass face and clamped onto the bezel. This water-filled magnifier enlarged the tiny image to something watchable from across a room. It worked. It was also optically terrible in the most wonderful ways.
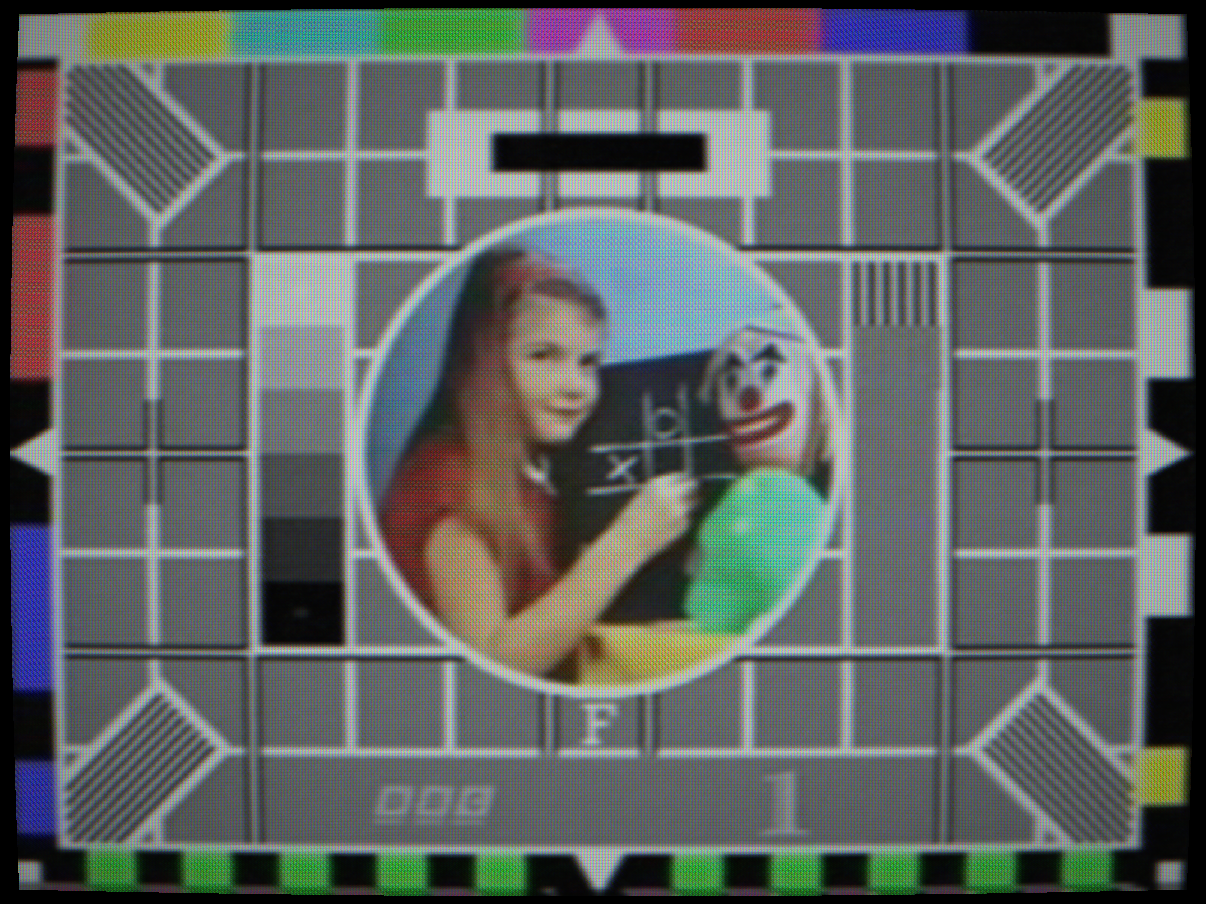
Barrel distortion, the fishbowl effect: A water-filled positive meniscus lens produces strong barrel distortion. The centre of the image is magnified significantly more than the edges, pulling the corners inward and giving the characteristic convex, fishbowl appearance. On a КВН-49, a moderately curved face produced barrel coefficients far higher than any CRT faceplate, the entire raster appeared to be painted on the inside of a glass bowl. The simulation maps a 0–1 strength slider to a barrel coefficient of 0–2.4×, compared to 0–0.25× for the standard CRT curvature control, reproducing the dramatic curvature of the original lens at full strength.
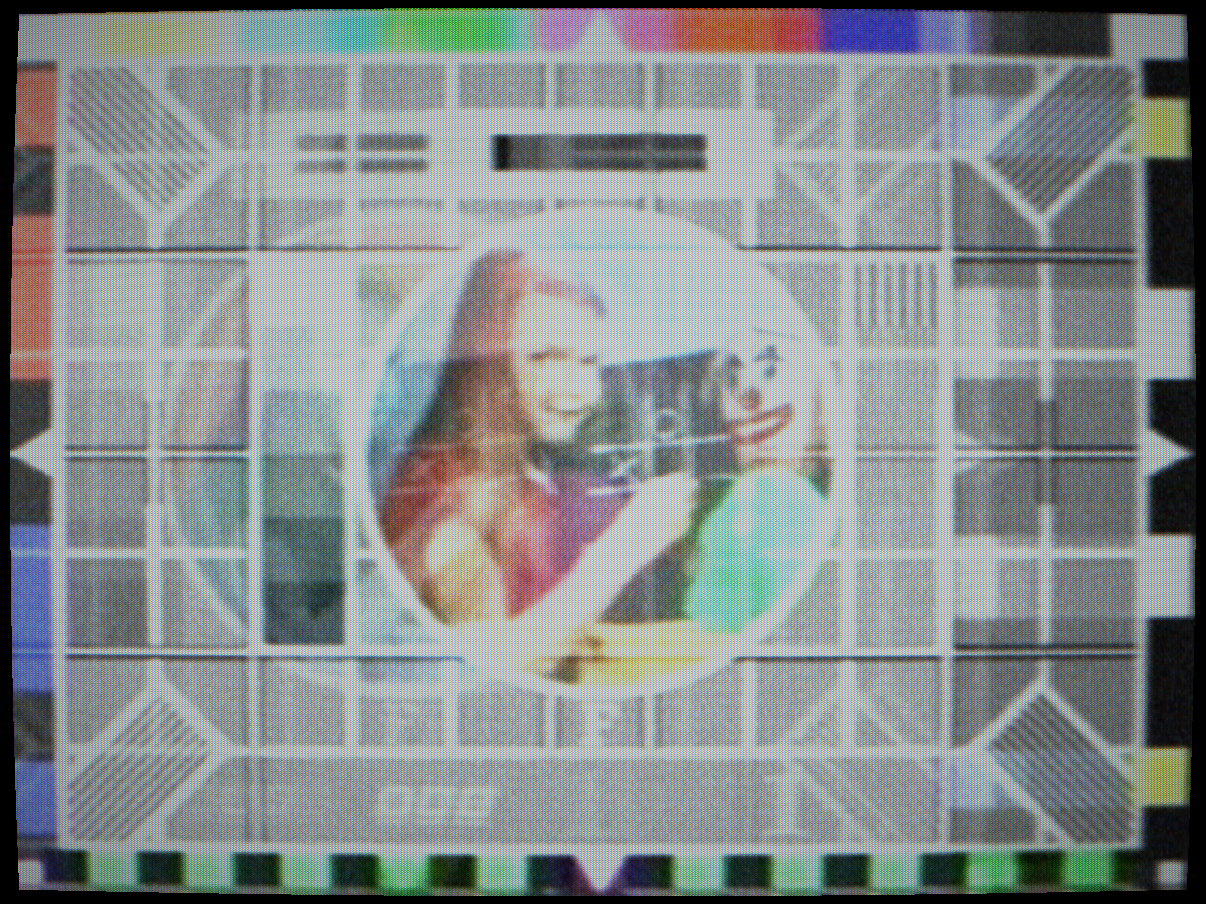
Chromatic aberration: Water has an Abbe number of approximately 55.9, meaning it disperses blue light more than red. Through a thick curved water lens, the red, green, and blue components of the image focus at slightly different distances and are displaced by slightly different angles. Toward the periphery, the three colour channels split visibly, sharp edges grow coloured fringes, and fine detail blooms into a rainbow smear at the outer third of the image. The simulation models this as a radial per-channel UV offset growing with distance from the lens centre: blue displaced slightly outward (more magnified, water bends short wavelengths more strongly), red inward (less magnified), green held at the nominal position.
Fluid surface ripple: The water or glycerol in the lens tank was not perfectly still. Thermal convection from the CRT's own heat, vibration from the power transformer, and the natural meniscus curvature of the liquid all contributed a slow, gentle wave motion to the lens geometry. A КВН-49 that had been on for an hour would have a noticeably different optical character than one just switched on. The simulation applies two beating sinusoidal waves per axis at approximately 2 Hz, driven by the frame counter, producing a slow optical undulation that varies across the surface without ever quite repeating.
Circular lens mount vignette: The magnifier tank had a circular aperture cut into its metal front panel, the viewing window. Outside this aperture, the metal frame was fully opaque. The circular boundary, with a soft optical roll-off at the edge from the lens glass terminating against the mount, produced a hard circular vignette that the user would have seen as a black bezel around the enlarged image. The simulation renders this as photometric black beyond the aperture radius, with a 22 mm soft edge matching the optical termination of a real lens mount.
Gyroscope parallax (iPhone & iPad): Tilting a real magnifying lens relative to the object behind it shifts which part of the image is enlarged, tilt right and the magnified centre moves left across the CRT face. On iPhone and iPad, the simulation reads device attitude from CoreMotion at 60 Hz, using roll and pitch to shift the effective centre of the lens warp in real time. The reference attitude is captured when the lens is first enabled, so whatever orientation the device is held in becomes the neutral position. Parallax sensitivity scales with lens strength, a more strongly curved lens shifts more visibly for the same physical tilt angle, matching the angular geometry of real optics.
КВН-49 in Soviet culture: More than a technical curiosity, the КВН-49 became a genuine cultural artefact. By the early 1950s, groups of neighbours would crowd into whichever apartment had one, the magnifier lens pushed viewable distance out to perhaps three metres, enough for ten people if they sat close together. The name КВН was later borrowed for Клуб Весёлых и Находчивых (Club of the Merry and Resourceful), the Soviet comedy improvisation programme that debuted in 1961 and is still broadcast today, one of the longest-running television formats in history, spanning the Soviet era, its collapse, and thirty years of independent broadcasting. Surviving КВН-49 sets, complete with their glass tank, are prized by Soviet-era collectors. The combination of the tiny screen, the ungainly magnifier, and the ritual of gathering to watch state television through a tank of water is one of the more specific windows into everyday Soviet domestic life that a physical object can offer.
Screen: 105 × 140 mm · Standard: 625-line 50 Hz (OIRT System D) · Lens fill: distilled water or glycerol · Production: 1949–1962 · Barrel coefficient: 0–2.4× · CA: Abbe V_d ≈ 55.9 (water) · Parallax: CoreMotion attitude 60 Hz, iOS/iPadOS